Wednesday, 9 April 2014

Straight Lines, Straight Lines and Straight Lines

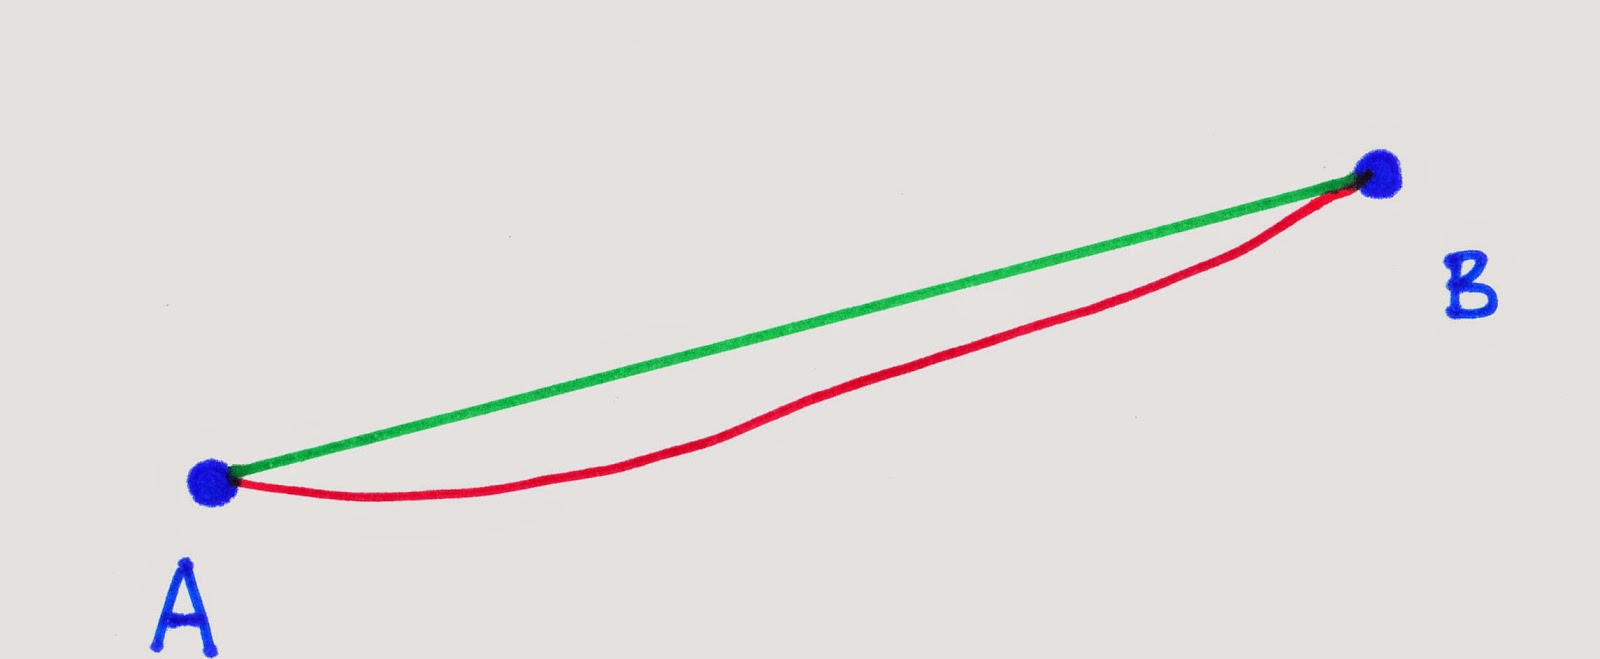
If you wanted to travel from point A to point B (there's ice-cream at point B) what route would you take? You're real hungry so you may choose the green route because the shortest distance between two points is a straight line. Or you may be a daydreamer like me and choose the red route and see some cool clouds along the way. 


That's all fine for the math textbook, but let's name points A and B. Say there is REALLY good ice-cream in Hawaii. So point A we designate to Sydney, Australia and Point B is Waikiki, Hawaii. 


Straight line between the two points gets us there right?


Google, what are you doing? I put the red dotted line in myself. Are Google daydreamers like me? Maybe. But I certainly don't think that airlines are. Longer routes equal more fuel used equal less profits. Maybe there is something about Australian planes, or pilots. 


Nope. It seems that everyone is flying on curved routes. What the hell is going on? 

We all live on a sphere.

Firstly, a straight line across the surface of a sphere is always curved. Put a string along the surface of a globe and you have a curved string. There's just no way to put a length of string across the surface of a globe and have it completely straight (let's not go into calculus people).

Secondly the maps that I am showing and the Google uses are flat. They do not show the real world, they show a projection, parts of the globe are distorted. Therefore straight lines will also be distorted and curved. 

The trouble all happens when we take a straight line on along the surface of a sphere, a three-dimensional object, and try to draw it on a flat two-dimensional sheet. It just doesn't work properly.

One of the greatest examples of straight lines appearing curved is one that is constantly in our skies, the moon. Have you ever thought about the phases of the moon? We know that one part is light, and one part is dark and they intersect in a curved line apart from the half moon.


The line between light and dark (known as the terminator) is a straight line, well as straight as you can get on the surface of a sphere. But it is a straight line from the north to the south pole of the moon as the moon is always half-lit by the sun. We just see it as curved when we see it at an angle, we see differing amounts of the part in shadow throughout the month. But the line is always straight!

Taken to the extremes straight lines around a globe can look quite curved. Have you ever watched a movie with the NASA control centre in it, like 'Apollo 13'? They often have a large map up on the front wall with the orbital path plotted over a projection of the surface. It's always a wave isn't it? It appears to be very far from a straight line. But it is!

If we use the International Space Station for example, it has an orbit which when viewed in it's side is a straight line. It goes in a circle around the earth in a plane.


But project this onto a two-dimensional surface and you get a lovely sinusoidal wave. And because the Earth turns relative to the International Space Station, the next orbit is slightly offset and it passes over different territory.


So you can see that straight lines are not that straight sometimes, and even curved lines can be straight in three-dimensions. In a recent blog article, the wonderful Ken Jennings shows us another straight line across the globe.

Did you know that you can sail from Pakistan to Kamchatka in a straight line? 


 Just like the orbits, it certainly doesn't look straight. And it is an awfully long way, it's definitely the scenic route. Don't believe me, check out the video animation.


So is the shortest route between two points a straight line? I hear you your brain groaning over that question now. But the answer is still yes. It's only no when we put a restriction on it. And what is the one restriction that has been put in place in all these above examples? That you travel on or above the surface of a sphere.

Theoretically you could tunnel through the earth from one point to another in a straight line that is the shortest distance between these two points. 


You don't need to pass through the centre of the earth unless you are going to the exact opposite side of the globe. And if you were you're likely to come out awfully wet. With 70.8% of the surface of the earth being water you are more than likely have to pack a pair of trunks. The lucky and dry centre-earth tunnelers live in Chile and Argentina, Malaysia, Philippines, China, Indonesia, Greenland, far north Canada and some of Antarctica. Oh and some of New Zealand corresponds with Spain.


So what route will you now choose?


Friday, 7 March 2014

Book Review: 'You Are Not So Smart' by David McRaney

This great work boils down to: "Despite millions of years of evolution your brain is a jumbled mess of neurons that covers up it's downfalls by lying to you constantly. Here are just 46 ways your brain is being an asshole."

Just like Dawkins argues against a creator in showing that evolutionary adaptations can be flawed and seemingly badly designed, David McRaney shows in this work that despite those claims that the human mind is one of the most complex structures in the known universe, it's shoddily put together, with bits that don't work together and bits that were added on at the last minute and that the only way it 'works' is that it constantly lies to itself about the reality it exists in. You have in your head a used car salesman.

David demonstrates the limitations of our brains by picking out these 46 different ways our brain lies to us and writing a small chapter on each. Each lie is well researched and refers to different published studies for evidence. For example the chapter on why you have too many Facebook friends talks about studies about the limitations of how many people you can hold in a social circle in the physical world and compares these figures to the data on Facebook. He also talks about the reason why you 'befriend' all those people using the internet.

Most interesting are the chapters that highlight the limitations in vision and the comprehension of sensory input. You are not a little person in a box watching a ultra high definition surround sound movie of your existence. More like your homonculus watches a scratchy silent movie from 1908 with no sound and missing film cells, a friend tells them about the soundtrack over the phone.

There are also great chapters on how you think you are better than everyone else out there. He actually gives statistics on how many people think they are better than average drivers and how many people think they have a better than average IQ. The figures will astound you.

I highly recommend this fun and enlightening read. It certainly will make you question everything you think and perceive, which is a practice that all science endorses strongly. This book is so much more than your average pop-psychology book that litters the popular science section of bookshops and libraries. It holds no punches and approaches the subject from a critical standpoint. Weeks after reading this book I'm still laughing at my brain when I know it's lying to me.


Wednesday, 5 March 2014

A Manual For Civilisation

I am a great fan of The Long Now Foundation, a group of people that foster long term thinking and projects within the framework of 10,000 years. They believe it counterbalances the rise in short-term thinking and planning that has arisen in the 21st century, where people can only think ahead to the next iphone model or the next election.

A great quote by Daniel Hillis is given for part of the inspiration of the foundation:

"When I was a child, people used to talk about what would happen by the year 02000. For the next thirty years they kept talking about what would happen by the year 02000, and now no one mentions a future date at all. The future has been shrinking by one year per year for my entire life. I think it is time for us to start a long-term project that gets people thinking past the mental barrier of an ever-shortening future. I would like to propose a large (think Stonehenge) mechanical clock, powered by seasonal temperature changes. It ticks once a year, bongs once a century, and the cuckoo comes out every millennium."


This clock is now being manufactured and situated in the Sierra Diablo Range west in western Texas with the prototype on display in the London Science Museum.


Another project undertaken by the Foundation consists of curating a library with the intention to hold volumes that would act as a manual for civilisation. While Long Now does not predict the downfall of all civilisation in the near future, they think it is a great premise for a collection of physical books to complement their new office and meeting space in San Francisco. They are aiming at a 3000 book limit with a breakdown of types of books given:

Image Source: The Long Now Foundation.

Mechanics and Civilisation includes technical books on how to build things and how to find and refine natural resources. In essence all of the technical know-how. Cultural Canon is a series of books believed to show the essence of human civilisation including Plato, Shakespeare and others. The Science Fiction component will consist of works of speculative merit where possible futures and big ideas are discussed. Futurism will consist of non-fiction speculations upon the future of the human race with an emphasis on our history.

The collecting has already started with suggestions being made by famous Long Now supporters such as Brian Eno, Neal Stephenson, Neil Gaiman, Hugh Howey, David Brin and Bruce Sterling.

Last month I read an advance copy of Lewis Dartnell's "The Knowledge" which aimed to be a technical manual on rebooting civilisation after collapse. I think this book would be a great addition to the Mechanics of Civilisation section.


What books would you like to be added to such a collection?


Wednesday, 26 February 2014

The Oldest Rocks on Earth

At 200 X 400 micrometres this zircon crystal extends the limits of our understanding of early Earth back to 4.4 billion years ago, a mere 100 million years after the Earth was formed and only 160 million years after the Solar System formed. This discovery pushes back the date for when Earth first had a solid crust and weakens the theory that at this time the Earth was hot and entirely molten. It seems the conditions were much milder much earlier than we thought. There are two methods of dating these minerals, via radioactive dating methods and using atom probe tomography. The research group who dated this sample used atom probe tomography, but I am going to talk about radioactive dating methods.

Zircon crystals are brilliant for radioactive dating because of two reasons. Firstly they're tough, they last a long time and can withstand an amount of tectonic pressures. Secondly, and most importantly, they form with radioactive uranium in their structures AND they do not form with lead in their structures. Why is this significant?  Radioactive uranium degrades into lead. So we can say that any lead present in the crystal is due to the decay of the uranium and nothing else. Zircon crystals are special in another way. They form with two different radioactive isotopes of uranium which both degrade at their own independent rates into two differing isotopes of lead.

Radioactive decay happens with precise timing. We know how radioactive decay works and at what rate it happens at. It's an exponential decay that is as regular as clockwork. Whether this happens over billions of year, hours, minutes or microseconds, all radioactivity follows exponential decay that is given in a simple mathematical expression.

So essentially zircon crystals are like clocks that were set to zero when they solidify from molten rock. Actually more like two individual clocks in each crystal because of the two different radioactive decays. All we need to do is to look at the ratio of uranium to lead to tell what time it is, just like looking at the two hands of an analogue clock. And the beauty is that we have two clocks running simultaneously and confirming each other.

So you start off at time zero with 100% of the parent isotope. This degrades at an exponential rate to a daughter isotope. For example:


We can say how fast each radioactive decay occurs by a concept called 'half-life'. A half-life is defined as the time when half the amount of the parent isotope has decayed into the daughter isotope. So at time zero there is 100% parent isotope and at the half-life there is 50% parent isotope and 50% daughter isotope. And because this decay is exponential, at 2 times the length of the half-life the parent isotope is at 25% and the daughter at 75% and so on.


Each radioactive decay happens at its own rate. For example the half-life of uranium-235 is 704 million years, the half-life of uranium-238 is 4.5 billion years, while ruthenium-106 is 1 year, carbon-11 is 20 minutes and lithium-12 is 10 nanoseconds. So for the two uranium decays in zircon you can see that the decay from uranium-235 happens at a much faster rate than that of uranium-238.

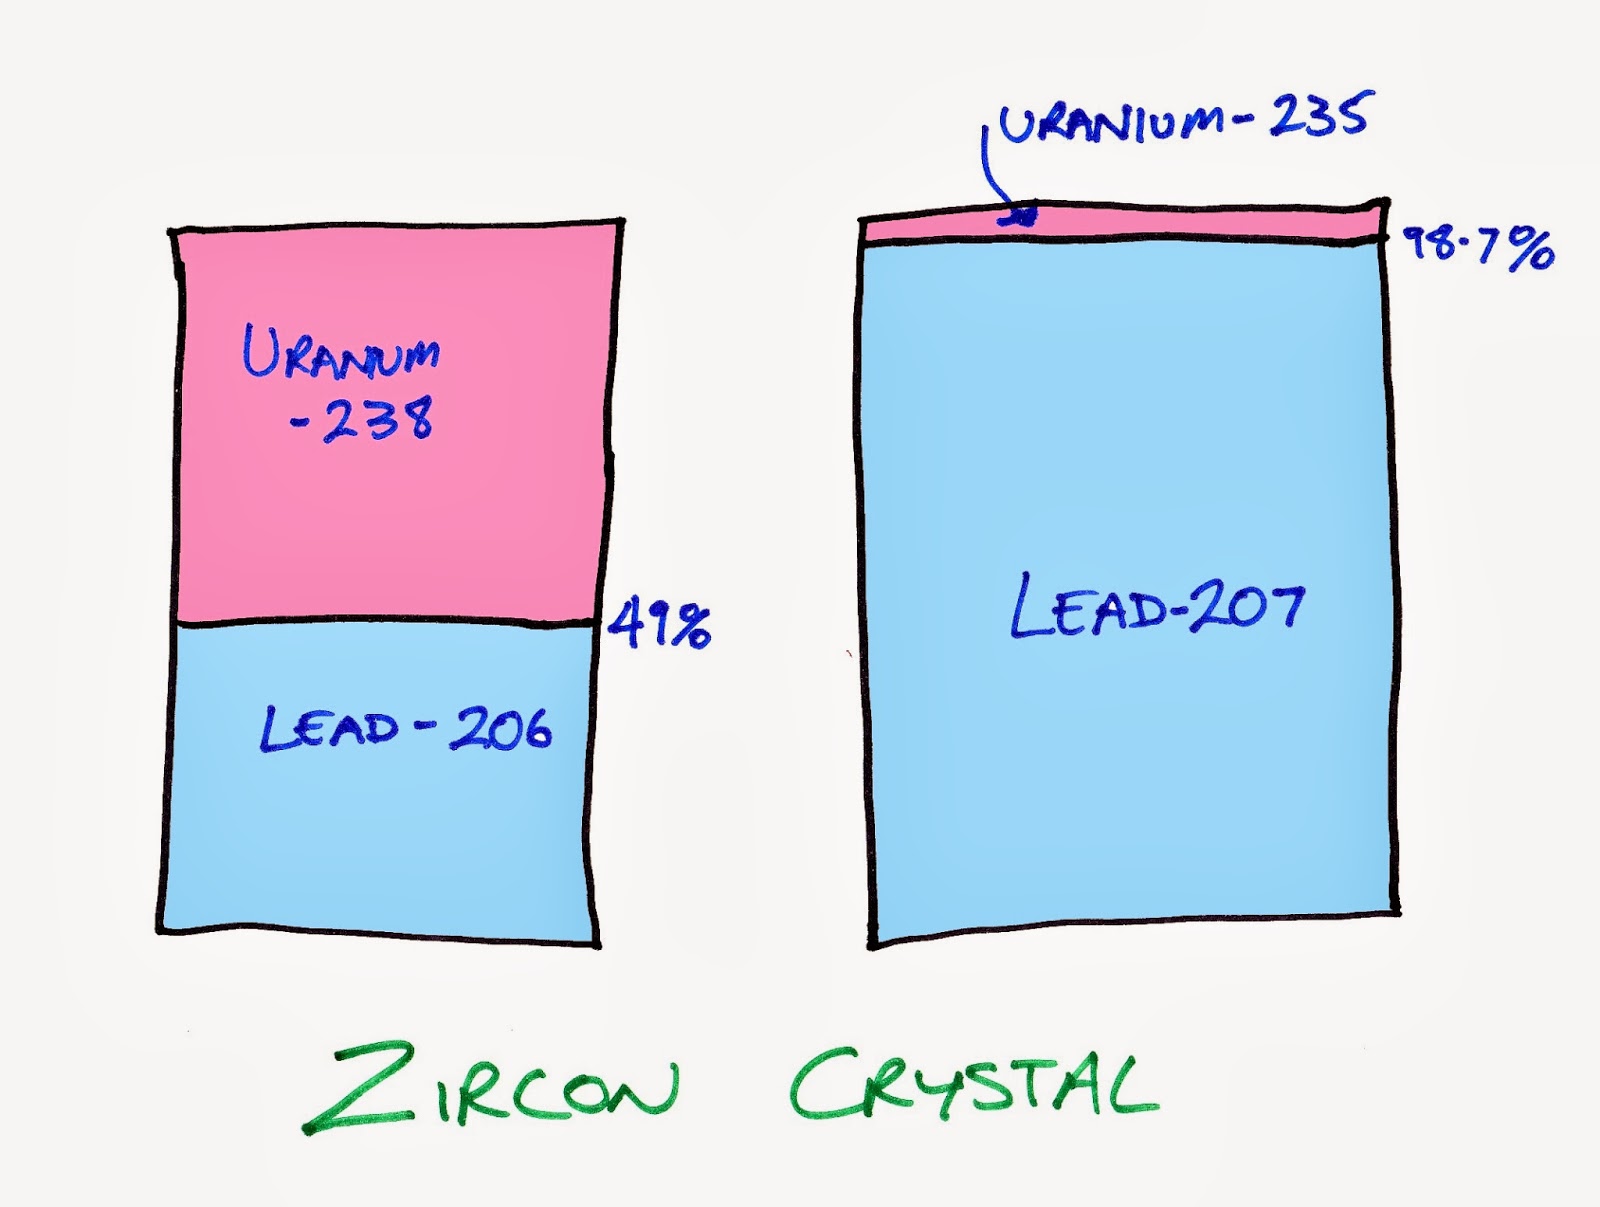
Scientists trying to age a zircon crystal look at how much of uranium-238 versus lead-206 there is and how much uranium -235 versus lead-207.


You can use these ratios to back calculate ages of the crystal. Looking at uranium-238 there is nearly a 50-50 mix of parent to daughter isotopes, so therefore it is just under the age of its half-life of 4.5 billion years. With the uranium-235 you can see that most of it has decayed to lead-207 and there isn't much uranium left at all. It has gone through many half lives. In fact we can calculate it has gone through 6.25 half-lives and 6.25 multiplied by 704 million years is 4.4 billion years. So you can see how the correlation of the ages calculated of these isotopes are a powerful tool with both results pointing to 4.4 billion years or so.

The same method of looking at the ratio of parent to daughter isotopes is used for all radioactive dating. The other type of dating that you may have heard of is radiocarbon dating or carbon-14 dating. This method looks at the amount of carbon-14 in a sample which could be some bones of animals or humans or trees or other living things. Because all living things have a large amount of carbon in them, some of the carbon is naturally occurring carbon-14 (as opposed to the normal carbon-12). When a living thing dies it does not absorb any more carbon into its system and the carbon-14 that remains decays. So the amount of carbon-14 left in a biological sample tells us how long ago it died. The half-life of carbon-14 is 5,730 years and so if we find half the expected carbon-14 in a sample is must be around the age of 5,730 years. This method is limited to around 60,000 years or 10 or so half-lives. After this time there is only 0.1% of the parent isotope left and the error becomes too large to be reliably date a sample.

So you can see how radioactive decay is a useful tool to date objects. You cannot use every type of radioactive decay out there to age objects, it is limited to systems where you know the concentration of one isotope at time zero. But luckily there are several systems where this occurs and knowing this fact gives us a glimpse into the distant past.

Just for the hell of it here is a zircon crystal from my own collection. It's probably nowhere near as old as 4 billion years as it is large and was from a location in the Northern Territory that is not renowned for it's age.


Massive Solar Flare

Photo from NASA / Solar Dynamics Observatory

These are a series of images taken of a massive solar flare that occurred on Monday the 24th of February. The images are of the same flare at the same moment but differ in that they are taken at different wavelengths. Kind of like if you took a photo of a butterfly at different wavelengths and one photo displayed all the red on the butterfly, another green, and so on. But these images are of light at smaller wavelengths than we can see, and at a much higher energy.

The wavelengths are given on the images in Angstroms or 10^-10 m, 100 million millionths of a metre. The light we normally see ranges from 3900-7000 Angstroms and these pictures are taken at wavelengths shorter than this. 1600 Angstroms is in the near UV spectrum, while 94 Angstroms is in the extreme UV. The actual colours shown in this photo are false and are just used to help visualise the images better.

While this is the largest recorded flare for this year, the scientists at the Solar Dynamics Observatory state that the effects were minimal here on Earth due to the location of the flare on the surface of the sun being directed away from us. No pretty aurora from this ejection.

Source: The Solar Dynamics Observatory Website.

Friday, 21 February 2014

Ronald E. McNair: Physicist and Astronaut


George Takei just shared this wonderful video on Facebook. It tells a story told by Ronald E. McNair's brother about an incident that happened in their childhood. Ronald E, McNair later became a physicist and astronaut. He was selected for the astronaut program in 1978 and later flew on the Challenger mission STS-41-B in February 1984. He was later selected for the ill-fated Challenger mission STS-51-L of January 1986 in which all crew died 73 seconds after liftoff.

The video is made by a group called 'Storycorps'.


Thursday, 20 February 2014

Watching a Demolition

So it's not everyday you get to witness the demolition of a 200 metre tall smoke stack in your hometown. But today I had the privilege and it was quite a spectacle. Everyone who wasn't at work at the time and even those at work flocked to many sites, hilltops and the mountains to watch the stack come down. I watched it from a far off vantage point, up at a look-out on the mountain escarpment.


The stack is what remains of a copper ore processing facility and was built in 1965 which was the height of industrial activity in Port Kembla, mostly dominated by a large steel plant. All throughout it's life the region has dealt with pollution concerns. In fact, in a brilliantly naive decision, the facility was built next to a public school. The solution once awareness was greater to install toxin monitors and alarms. The generation who saw it built and who had a hand in it's construction are still around. While most are proud of the great industrious work they did, it is hard to ignore the 40 year contribution of pollution in the region. As I was growing up in the 80's and 90's there were constantly news articles about pollution and acid rain in the region. The surrounding region would be covered by a film of fine metallic dust high in lead and other toxins.
The plant finally closed in 2003 and the facility has remained dormant since. Application for demoltion was sought in 2010 and demolition was postponed until asbestos could be safely removed before demolition.

It was amazing that everyone was out to see the event. I heard that all the nearby beaches and coastline was full of onlookers. Even my vantage point, a small tucked away look-out, was full of other like-minded people. There were retirees, couples and families all out to see this great event.

The aspect that astounded me most is how long it took to fall. I could have sworn the initial explosion (noticed by sight) happened 4 or 5 seconds before a noticeable lean in the stack. It came down very slowly and only left a small dust plume. I was probably about 10 km away from the tower and the sounds of the explosions had a significant delay which was quite hilarious in it's own right. A little lesson in relativity.

There were several helicopters and planes filming the event and here is footage taken by Channel 7 Sydney: